In the world of winemaking, the delicate balance of glucose and fructose management is key to achieving that perfect bottle of wine. These sugars aren’t just part of the natural grape composition – they’re the backbone of the wine flavor, sweetness, and overall quality. Whether you’re crafting a dry red or a delicate white, understanding and frequently measuring these sugars throughout the winemaking process is crucial for consistent fermentation and quality finished product.
During ripening, grapes undergo significant changes, one of the most critical being the accumulation of the monosaccharide sugars glucose and fructose. Initially before veraison, these sugars are nearly undetectable (Waterhouse et al., 2016). However by harvest, their combined concentration can reach between 180-250 g/kg (Waterhouse et al., 2016). After water, these sugars are the most abundant substances in grapes and pivotal in assessing grape composition and ripeness.
Glucose and fructose sugars serve as the primary substrate for yeast to produce ethanol during alcoholic fermentationand contribute to perceived sweetness of the final product. As yeast is glucophilic (they consume glucose more readily), the concentration of fructose is typically higher than glucose at the end of fermentation (Berthels, 2004).
Fructose is almost twice as sweet as glucose, making its presence particularly significant in influencing the sweetness and overall sensory profile of the wine (Moreno & Peinado, 2012).
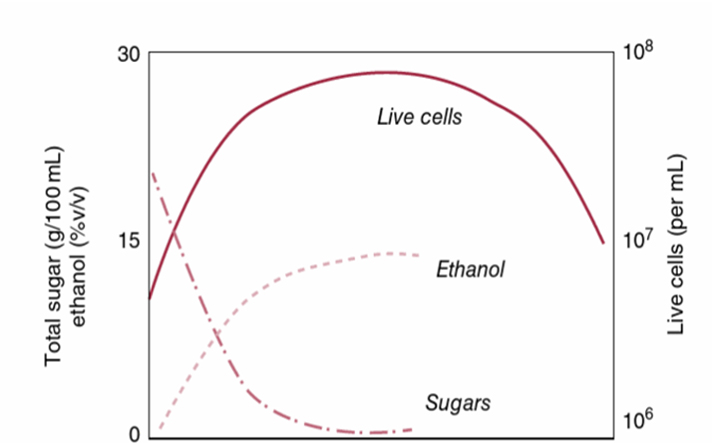
Figure 1: The relationship between live yeast cells, sugar and ethanol concentrations.
The sweet taste of sugars in wine not only enhances the perception of body, but also interacts with other taste and tactile sensations. For instance, sweetness can influence sourness, bitterness, astringency, and pungency, creating a more balanced and pleasant taste experience.
Measuring glucose and fructose in wine is essential for several reasons, all of which contribute to the quality, consistency, and regulatory compliance of the final product. These measurements are crucial for winemakers to achieve desired outcomes in terms of sweetness, fermentation efficiency, and adherence to industry standards.
Fructose is inherently sweeter than glucose, which directly impacts the wine sweetness and overall flavor profile. Higher levels of fructose can make the wine taste sweeter even if the total sugar content remains constant (Berthels, 2004). Understanding the ratio of these sugars allows winemakers to predict and control the perceived sweetness of the wine. This is particularly important for:
“Measurement is the first step that leads to control and eventually to improvement.”
H. James Harrington
The concentration of glucose and fructose can significantly influence the fermentation process. A balanced ratio of these sugars is ideal for smooth and efficient fermentation. An imbalance can lead to several issues:
At the time of publishing this article, accurate measurement of glucose and fructose is required for European labelling compliance and consumer information (Wine Australia, 2024). Providing precise information about sugar content on wine labels helps European consumers make informed purchase decisions.
Conducting glucose and fructose measurements at key stages of the winemaking process is crucial for monitoring and ensuring the quality of the wine. Here is a breakdown of the critical times to measure these sugars and the recommended frequency of testing.
Key stages for measuring glucose and fructose
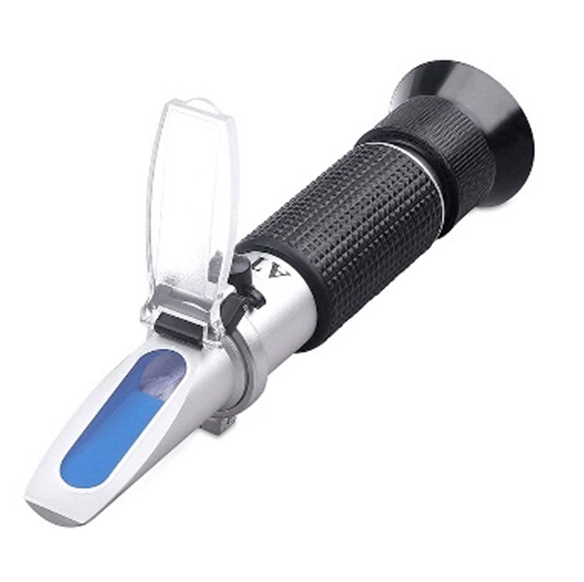
Figure 2: Refractometers are used to measure grape juice brix (dissolved solids) which is correlated to sugar content. (Image from www.walmart.com)
Regular and strategic monitoring of glucose and fructose at key stages of winemakingis essential for ensuring optimal fermentation, achieving desired sweetness levelsand maintaining product quality. Sentia measures glucose and fructose separately, detecting levels from 0.1 to 10 g/L for each sugar, making it an ideal tool for end-of-fermentation analysis in both dry and semi-dry wine styles.Want to see Sentia in action? Contact us today, and a team member will reach out to you to discuss how it can enhance your winemaking process!
What do you think? Contact us here and tell us about your sugars monitoring during fermentation. Did you find this article useful?
References
Berthels, N., Cordero Otero, R., Bauer, F., Thevelein, J., & Pretorius, I. (2004). Discrepancy in glucose and fructose utilisation during fermentation by Saccharomyces cerevisiae wine yeast strains. FEMS Yeast Research, 4(7), 683–689. https://doi.org/10.1016/j.femsyr.2004.02.005
Crowe, A. (2017). Checklist: Getting Your Wine Ready for Bottling Day. Wine Business Monthly.
Grainger, K., & Tattersall, H. (2016). Wine Production and Quality (2nd Ed.). John Wiley & Sons Inc.
Moreno, J., & Peinado, R. (2012). Enological Chemistry. Elsevier Science & Technology.
Waterhouse, A., Sacks, G., & Jeffry, D. (2016). Understanding Wine Chemistry.John Wiley & Sons Inc.
Wine Australia. (2024). Compulsory energy, nutrition and ingredient labelling in the European Union from December 2023.Australian Government, Wine Australia.
Zoecklein, B & Gump, B. (2022).Practical methods of evaluating grape quality and quality potential. In Managing Wine Quality. Vol. 1, Viticulture and Wine Quality (2ndEd.). Woodhead Publishing.
Your wine, time and effort is precious – don’t risk spoilage by cutting corners in free SO₂ monitoring. A tailored barrel management program should incorporate regular testing of each barrel, to eliminate the financial risk of compromised wine.
Wine production is a delicate balance of art and science, with each step meticulously managed to ensure the final product’s quality and longevity. Among the critical components in winemaking is the use of sulfur dioxide (SO₂). This compound plays a vital role in safeguarding wine against microbial spoilage and oxidative damage, making it an indispensable tool for winemakers (Waterhouse et al., 2016).
Sulfur dioxide is added to wine primarily to protect it from undesirable microbial growth and the detrimental effects of oxygen exposure. Without this protective agent, wines can suffer from a range of microbial and oxidative spoilage issues:
Anti-yeast: SO₂ inhibits harmful yeasts such as Dekkera bruxellensis, which can produce off-putting aromas reminiscent of horse sweat and medicinal odors (Grainger & Tattersall, 2016), and Saccharomyces cerevisiae, which can cause spoilage through unwanted refermentation.
Anti-bacteria: SO₂ prevents spoilage from bacteria, such as lactic acid bacteria which can cause taints like mannitol, mousiness, geranium odors, and diacetyl, and acetic acid bacteria which can produce vinegar-like and nail polish remover aromas (Bartowsky, 2009).
Enzymatic Oxidation: SO₂ decreases catechol oxidase activity, an enzyme that can lead to oxidative spoilage (Waterhouse et al., 2016).
Non-Enzymatic Oxidation: SO₂ scavenges hydrogen peroxide, preventing the conversion of ethanol to acetaldehyde (sherry-like, bruised apple aroma) and acetic acid (vinegar aroma and taste). It also binds acetaldehyde to prevent phenolic polymerization, which leads to premature aging, increased bitterness and astringency, and red pigment precipitation (Waterhouse et al., 2016).
Testing for sulfur dioxide is crucial because its protective level decreases over time due to various reactions (Waterhouse et al., 2016). Regular barrel-by-barrel monitoring helps to:
Each barrel, despite containing the same wine, undergoes unique variations in oxygen exposure, microbiomes, oak characteristics, and temperature (Zamora, 2019). These factors create distinct aging trajectories, requiring an individualized approach to monitoring and maintenance.
Frequent individual barrel analysis is crucial for reducing risks. This precision approach safeguards your assets and prevents quality downgrades.
Avoiding composite sampling pitfalls:
While composite sampling from a selection of barrels might seem efficient, it assumes all barrels have similar free sulfur concentrations. Sampling only a small subset can lead to incorrect assumptions, affecting the winemaker’s decision process and barrel management. To identify outliers and reduce variance and financial risk, transition to a higher percentage of barrel-by-barrel sampling and customized additions. This ensures accurate protection levels in more barrels, improved decision-making and early problem detection.
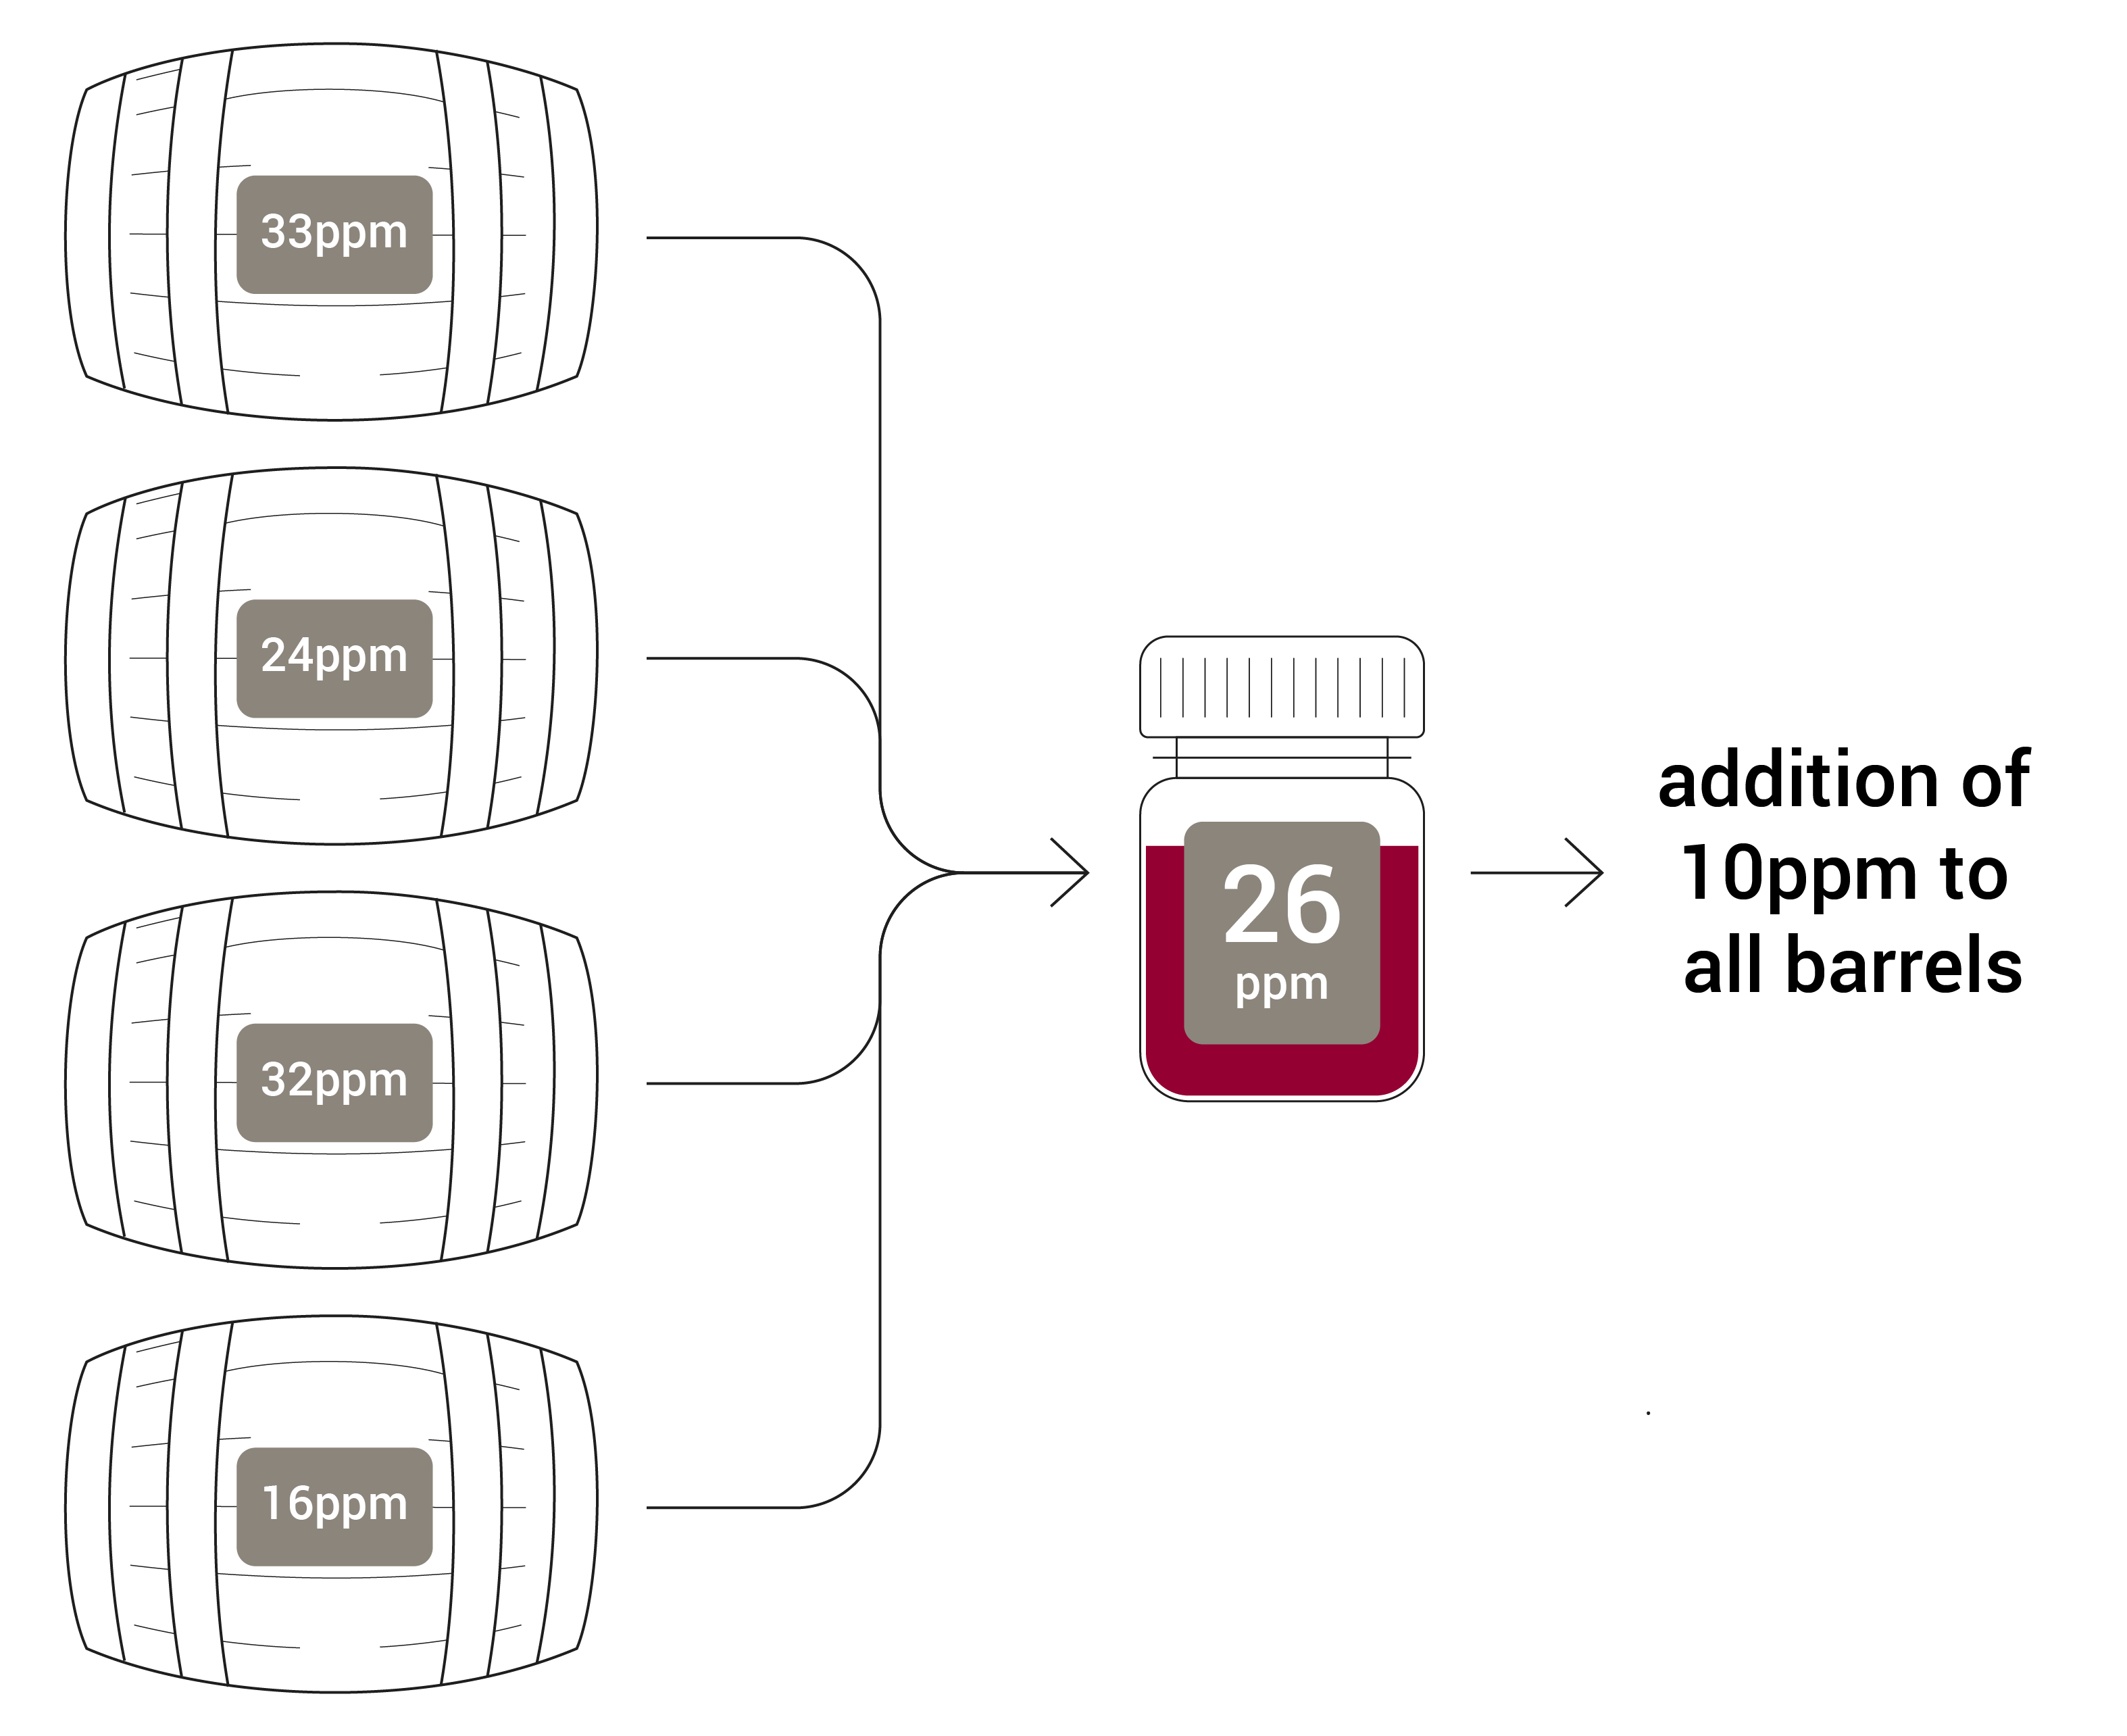
Tailored barrel sulfur management:
Tailored barrel sulfur management involves precise and frequent monitoring to adjust sulfur levels as needed, ensuring that each barrel reaches its critical sulfur point. This proactive approach is essential for maintaining the delicate balance required for premium wines and achieving consistent quality across all barrels.
Monthly and Bi-Weekly Testing
Regular sulfur dioxide testing is fundamental to this tailored management approach:
Special Considerations for High-Tier Wines
High-tier, premium wines should demand even more rigorous sulfur management. More frequent measurements ensure these premium products maintain their superior quality and meet market expectations.
Additional Testing Situations
Beyond the regular schedule, certain situations necessitate immediate sulfur dioxide testing:
Don’t be caught out – regular and precise monitoring of sulfur dioxide levels in each barrel ensures the longevity and quality of your wine, maximizing product quality and market value while minimizing potential downgrades and financial risk.
Do you agree? Tell us what you think here.
Are you sending samples to a lab for testing? See how much time and money you could save by testing free sulfur with Sentia. Check out the new Sentia Free Sulfur Analysis Cost & Time Saving Calculator here.


Bartowsky, E. (2009). Bacterial spoilage of wine and approaches to minimize it. Letters in Applied Microbiology, 48(2), 149–156. https://doi.org/10.1111/j.1472-765X.2008.02505.x
Grainger, K., & Tattersall, H. (2016). Wine Production and Quality (2nd Ed.). John Wiley & Sons Inc.
Waterhouse, A., Sacks, G., & Jeffry, D. (2016). Understanding Wine Chemistry.John Wiley & Sons Inc.
Zamora, F. (2019). Barrel Aging; Types of Wood. In Red Wine Technology, pp. 125-147., Edited by Antonio, M. Academic Press.
When turning on the Sentia Device for the first time, a connection to strong Wi-Fi signal is required, preferably 2.4 gHz (Wi-Fi frequency band). You can also use your phone hotspot.
During registration, you will also be prompted to enter your email to receive a verification code, which may go to your junk mail.
After setup, update your device to the latest software version. Learn how to update the Sentia software here.
User Guide and Sample Preparation Guide:
Review the User Guide and the Sample Preparation Guide before using Sentia.
Operating and Storage Conditions:
Operate the device within 10-30°C (50 -86°F) and <80% humidity (without condensation).
Store the device at 2-40°C (35.6-104°F) and <80% humidity (without condensation).
Connect to Wi-Fi:
When conducting a test, you do not require Wi-Fi connection, however whenever in range, we recommend staying connected to export test results and receive software and calibration updates.
Charging and battery care:
Use the supplied charging cord. Avoid using generic chargers. Maintain good battery charging habits and do not overcharge. Find battery care and maintenance tips here.
Cleaning:
Clean spills immediately. Follow general and strip port cleaning instructions here.
Use the Sentia analyzer case to further protect the device from spills.
Close Vial Lids:
Close vial lids after removing strips and pipetting buffers.
Do Not Mix Buffers:
Avoid mixing buffers from different vials, even if the batch number is the same.
Storage:
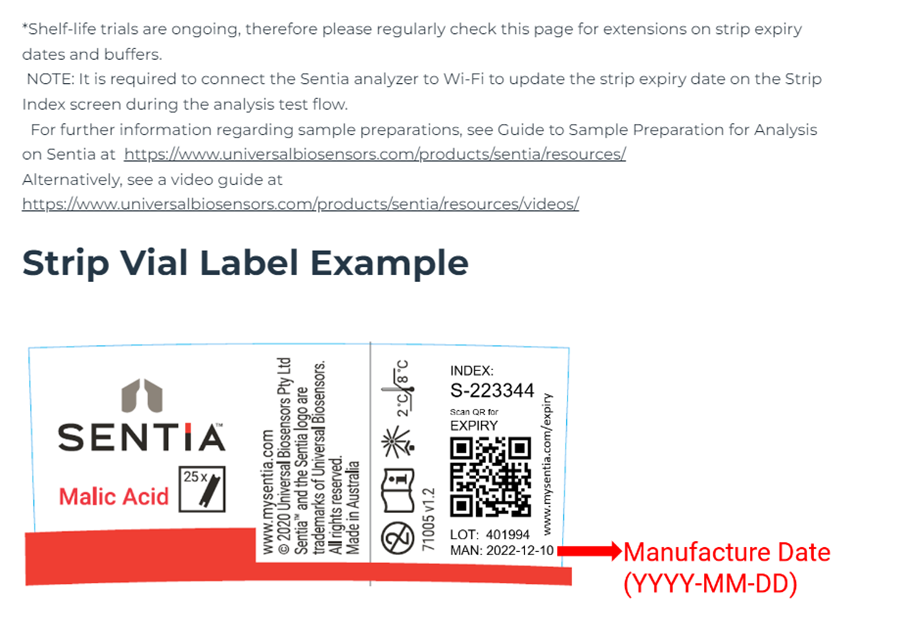
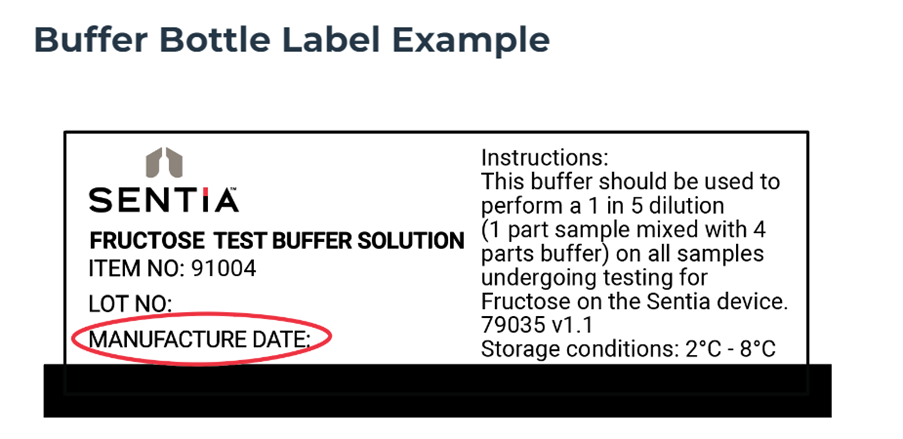
Store strips and buffers as recommended on the vial.
Use Strips Quickly:
Use strips within 10 minutes of removing from the vial.
Single Use:
Do not insert the strip into the device more than once.
Dry Hands:
Handle strips with dry hands.
Avoid Flooding:
Do not flood the test strip with the sample.
No Additional Sample:
Do not add more sample once analysis has started.
Retrieve Your Wine Sample:
Ensure the sample accurately represents the wine being measured and is consistently removed from the same homogenate area of the tank or barrel.
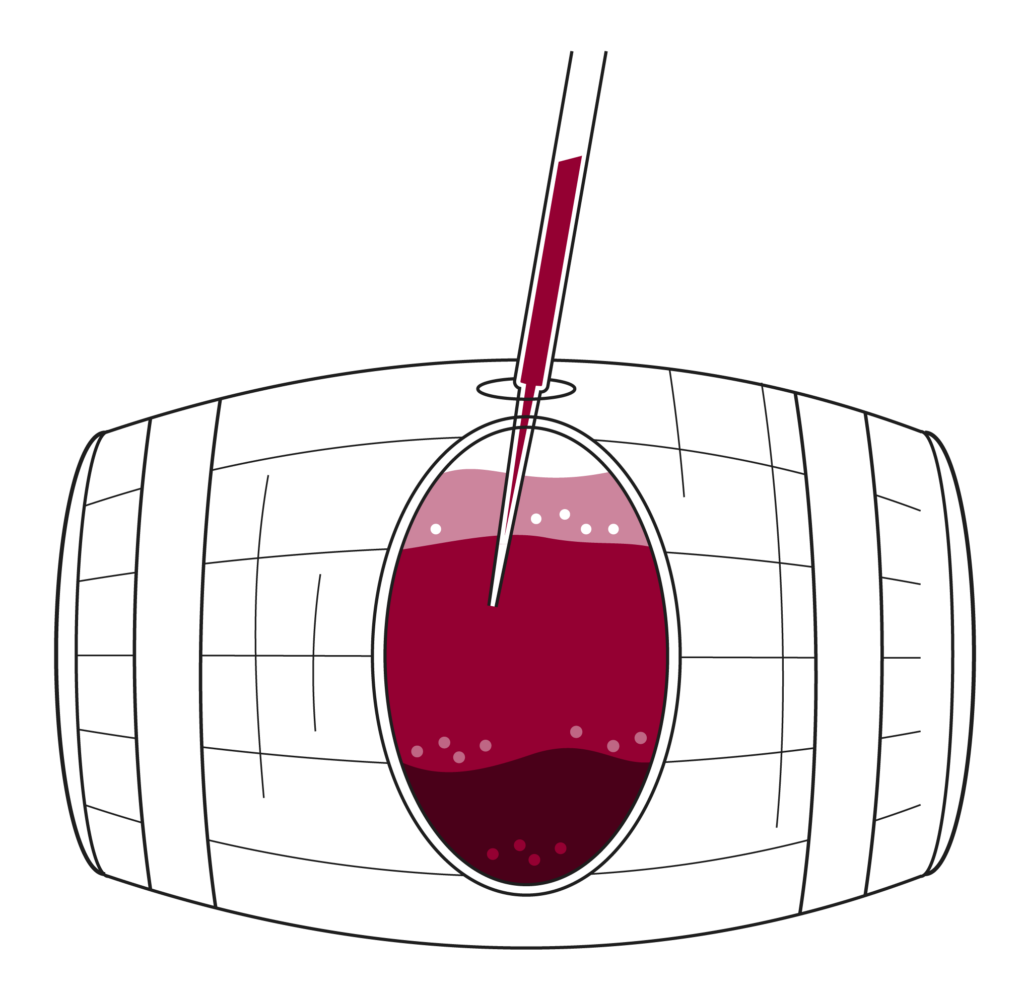
Immediate Testing:
Test the sample immediately after retrieval to prevent changes in the analyte concentration.
Sample Pre-treatment:
Degas samples with visible gas, except when testing for free SO2.
For turbid samples or those with excessive particulates, centrifuge, filter, or let settle before analysis, except when testing for free SO2. See the Sentia Guide to Sample Preparation here
Equilibrium:
Allow the wine to stabilize after any additions or significant changes. For example, after adding sulfur, allow the wine to stabilize for at least 12 hours, before conducting free SO2 analysis.
Minimize Oxygen Exposure for Free SO2 testing:
When transferring the sample, be careful not to draw air up through the transfer pipette to prevent oxygen from bubbling through the sample.
Ensure the pipette or wine thief is filled with sample to minimize the surface area of wine exposed to oxygen. Apply the sample immediately after drawing. If immediate analysis is not possible, fill a vial to the top with sample and cap tightly with no air pocket.
For further information regarding how to ensure accurate free sulfur results, see here.
Comparison testing
If conducting a comparison analysis, use the same aliquot for both Sentia and the reference method. Minimize the time interval between the Sentia test and the reference method test. For free sulfur, always test the sample on Sentia first due to the small sample size and associated risk of oxidation.
Using a Micropipette:
Ensure accuracy:
Follow the manufacturer’s instructions for use, maintenance, and service. Practice with water first to get comfortable with the pipette.
Select the right pipette:
Use the appropriate pipette for your task. For example, for Sentia, use a 100 – 1000 uL micropipette.
Use correct pipette tips:
Always use tips that are compatible with your pipette. Do not reuse tips to avoid contamination.
Timing of tests:
Conduct tests within 30 minutes of preparing the dilution.
Follow dilution ratios:
Only use the recommended dilution ratios to ensure measurement accuracy.
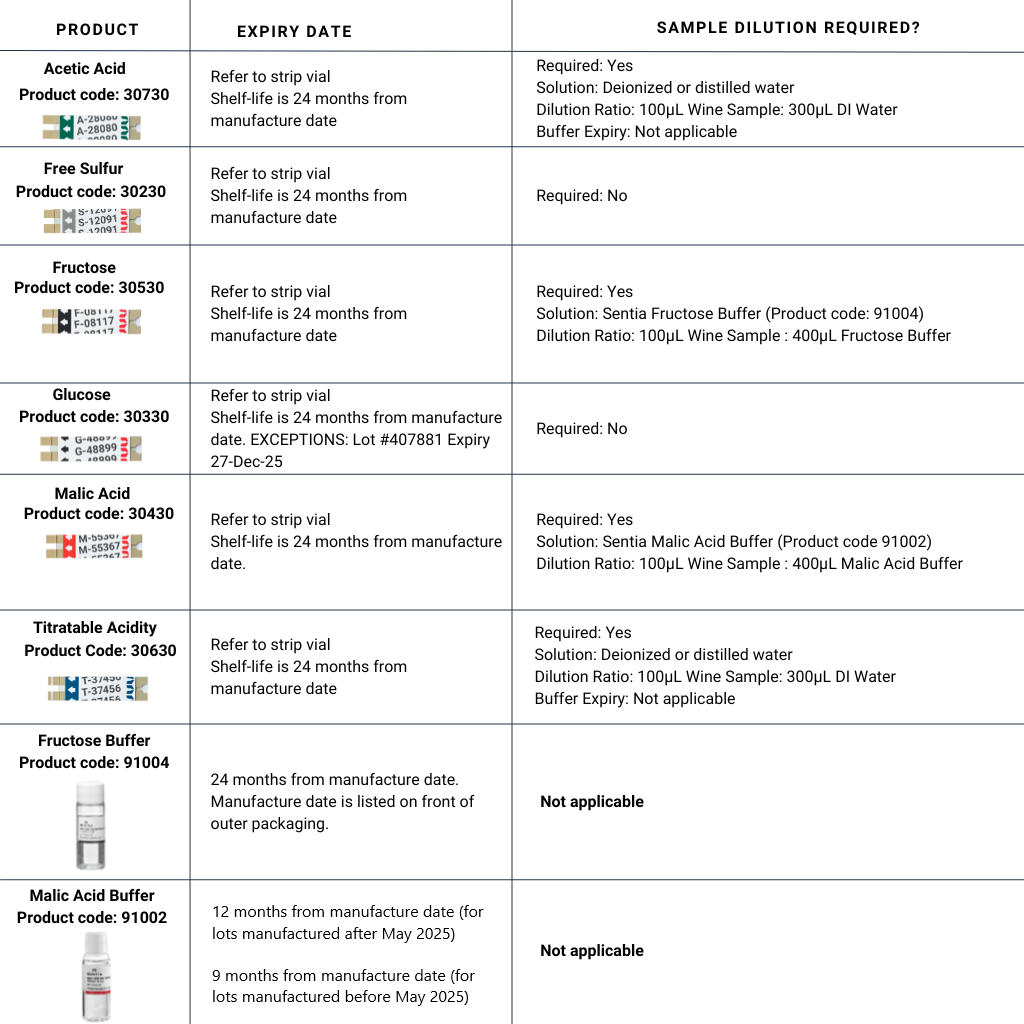
For additional support on the required dilutions for acetic acid, malic acid and fructose and using a micropipette correctly, please see our guides here.
For all additional help topics and to access the Sentia Customer Support Team, use our Support Portal here. To order strips contact your distributor, or if USA based, see https://sentiaanalysis.com/shop/
A step-by-step guide for updating software.


* Note: upon Wi-Fi connection it may take your device some time to recognize that a new software version has become available.
If you are still seeing no software update information after ~1 hour, try turning the device off/on again, then repeat steps.
By Marnie Sanderson, Product Specialist – Sentia
Released in 2023 as the sixth test on the platform, Sentia’s acidity method measures the titratable acidity of wine and grape juice all in less than 60 seconds. The UBI patented test strip utilises a salt mediated reduction of H+ to H2, which generates an electrochemical signal that is captured by the Sentia device. Using machine-based learning models, the Sentia intelligence system then correlates this electrochemical signal with the industry recognised titration method commonly called titratable acidity.
However, within the wine industry the terminology used to describe this method is swapped interchangeably between total acidity and titratable acidity, regardless of the titration methods inability to capture the total amount of wine acids within the sample. Adding to the confusion is that the method used to calculate titratable acidity can also change depending on which part of the world you are from.
So how should the wine industry define and describe our acidity measurements in wine, and what are the differences between titratable acidity measurements around the globe?
There are some slight but significant distinctions between the terms titratable acidity and total acidity that are important to define, in order to understand why confusion arises around these terms when used synonymously.
Titratable acidity measures the amount of carboxylic acid protons in a sample that can be recovered during titration with a strong base (Boulton, R. 1980). In the wine industry, the titrations end point differs usually as a function of the analyst’s regionality of work or education.
Total acidity quantifies all the acidic protons within a sample, both donated and undonated, and therefore captures the entirety of acids present. This can be performed using spectrometry or chromatography laboratory methods.
The definition differences between the two terms are a reason why using the term “total acidity” in place of “titratable acidity” for the general titration method, is technically incorrect.
Regardless of the definition technicalities, a study by Boulton (1980) also found that the amount of acids recovered by titratable acidity at pH 7.0 was only 74% of the total acids present. To achieve full total acidity recovery, the sample must first be passed through a column with ion-exchange resin and all the carboxylic groups released before the titration step (Rajković, M. et al. 2007). This highlights further that an inherent difference exists between total and titratable acidity and is the second reason why using these two terms interchangeably can be inaccurate.
As the acidic characteristics of juice and wine are determined by relatively weak organic acids (Torress, A.R. et al. 2011), the titration of wines with a strong base will provide a meaningful acidity measurement fit for winemaking purposes. Titratable acidity is also simple enough to be taught to inexperienced personnel and cheap to measure, which is another reason why it is the industry standard adopted for measuring acidity in wine and grape juice. There are also automated titration instruments such as the Hanna Automatic Mini Titrator 230V or the Metrohm 916 Ti-Touch that offer further simplicity if the budget allows.
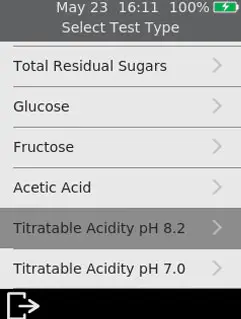
Regardless of whether you are using a manual or automatic titratable acidity method, all follow the same traditional principle. That is, slowly adding a strong base (usually sodium hydroxide) to a known amount of wine until it reaches a pre-determined end point which allows you to calculate the concentration of acids in the wine. In European countries and as shown in figure two, winemakers titrate to pH 7.0 and express the result as sulfuric acid. In other continents, winemakers titrate to pH 8.2 and express the result as tartaric acid. Results calculated to two different end points and expressed as different acids depending on your global location or educational and work influences, generates another layer of confusion.
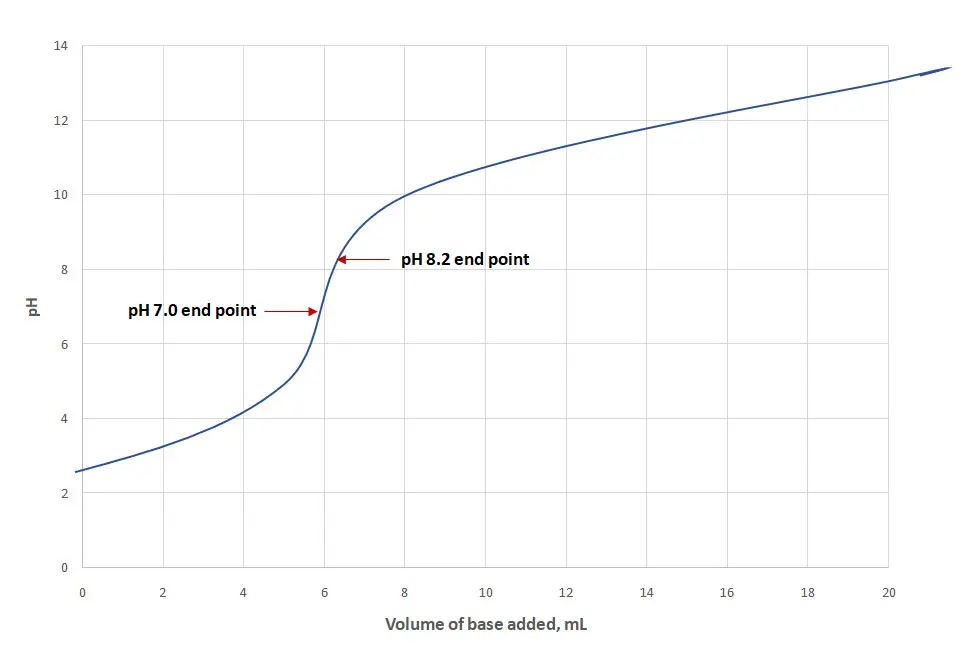
When titrating wine or juice with sodium hydroxide (the equivalent to titrating a weak acid with a strong base), the equivalence point occurs at a pH above 7.0 (Iland, P. et al. 2004). As pH 7.0 is where the dye indicator bromothymol blue changes colour, this is likely one reason historically that European nations measure to this end point.
Since wine acids are weak organic acids which are reluctant to donate their protons to a base at pH 7.0, some would argue that titrating to a higher pH of 8.2 is more correct, as this is where come donation is complete (FIVS, 2015). For this reason, and the fact a phenolphthalein indicator turns pink at this range as well, many of us choose a pH of 8.2 as our chosen end point when measuring titratable acidity.
As different amounts of base are used to reach each endpoint, the difference in acidity of the same wine being titrated to pH 7.0 and 8.2 is around 6-8% (Boulton, R. 1980). Therefore, comparing a USA based Chardonnay with USA titratable acidity measurement of 6.0 g/L has a very different meaning (and acidity level) to a Riesling grown in Germany with a European titratable acidity measurement of 6.0 g/L as well.
Adding further complexity is that titratable acidity is expressed as though all the available protons were donated from one acid species. Those who measure titratable acidity to pH 7.0 usually express it in units of sulfuric acid, whilst those that measure to pH 8.20 express it in units of tartaric acid, which is the acid of highest concentration in grapes. Nevertheless, both expressions are incorrect and misleading, as the acids encompassed by the titration method incorporates many organic acids.
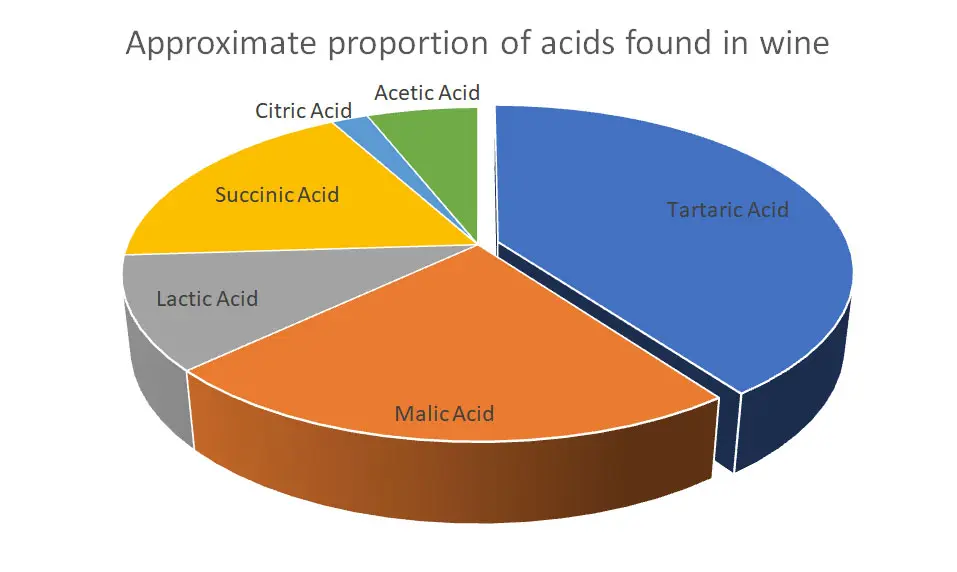
There are many acids found in wine and grape juice besides tartaric acid, some more prevalent than others. When using Sentia or any titration-based method (even if you call it total acidity) you can expect the following acids to be captured:
Of these acids captured, tartaric and malic acids account for the majority within a wine (see figure three). Some studies such as that by Volmer found they accounted for over 90% (2007), whilst another at the Australian Wine Research Institute found this number is more like 60% (Wilkes, E. 2016).
Regardless of the technical definition differences, the two terms, titratable and total are often used synonymously, even when referring to the same industry standard titration method. That is, titrating a volume of wine with a basic solution to get to a particular pH end point.
For example, the recommended method provided by the International Organization of Vine and Wine (a European based group), calls the measurement of acids in wine total acidity. However, by its method description, it recommends a titration to a pH 7.0 end point. As this method would not recover all the hydrogen ions expected from the acids of grape juice and wine (Boulton, R. 1980), it is understandable then, why calling the titratable acidity method “total acidity” causes confusion for those of us who like chemical definitions.
However, at the end of the day, there is a relatively simple rule to go by.
If you are comparing Sentia to your existing method of measuring acidity, you should consider the chemical reaction occurring. It is likely, regardless of whether you define your historical reference measurement as titratable acidity or total acidity, that you are still titrating your sample with a strong base (or an equivalent method). The Sentia acidity measurement correlates to this titration method in all corners of the globe – that is and as shown in figure one, to the historically used end points of pH 7.0 and 8.2 by a simple selection in the test type screen.
Boulton, R. (1980). The Relationship Between Total Acidity, Titratable Acidity and pH in Wine. American Journey of Enology and Viticulture, 31(1), 76 – 80.
Iland, P., Bruer, N., Edwards, G., Weeks., S & Wilkes, E. (2004). Chemical Analysis of Grapes and Wine: Techniques and Concepts. Patrick Iland Wine Promotions Pty Ltd.
FIVS. (2015). Harmonizing Expression of Measurement Results in Wine Analysis: Testing for Total or Titratable Acidity (TA) of Wine. International Wine Technical Summit, Technical Brief.
International Organisation of Vine and Wine. (2023). Compendium of International Methods of Wine and Must Analysis, Volume One. International Organisation of Vine and Wine.
Rajković, M., Novaković, I., & Petrović, A. (2007). Determination of Titratable Acidity in White Wine. Journal of Agricultural Sciences, 52(2), 169 – 184.
Torres, A.R., Lyra, W., Andrade, S., Andrade, R., Silva, E., Araújo, M., & Gaiao, E. (2011). A Digital Image-based Method for Determining of Total Acidity in Red Wines Using Acid-base Titration Without Indicator. Talanta, 84, 601 – 606.
Volmer, D., Curbani, L., Parker, T., Garcia, J., Schultz L., & Borges, E. (2017). Determination of Titratable Acidity in Wine Using Potentiometric, Conductive, and Photometric Methods. Journal of Chemical Education, 94, 1296 – 1302.
Wilkes, E. (2016). Wine Acids, Not Just Tartaric. Technical Review No. 221. The Australian Wine Research Institute, 10 – 13.
With harvest approaching, join us for a 45 minute webinar which will explain why Sentia is the most convenient wine analysis tool available to help you through your busiest time of the year.
Date: July 27th Time: 1pm PDT US
National Sales Manager Pelle Nilsson will introduce Sentia, followed by an explanation of the technical platform by the scientists who developed it. We’ll cover the hardware, software and strip technology which supports tests in just minutes for fructose & glucose, malic acid, titratable acidity, free SO² and acetic acid.
There will be time for Q+A after the presenters so you can be confident you’ll be armed with all the information you need to revolutionise your wine testing. Attendees will be offered a pre-harvest saving on analyzer purchases.
Please register for “Sentia – wine testing made easy during harvest and beyond” on Jul 27, 2023 1:00 PM PDT at: https://attendee.gotowebinar.com/register/3200212588094784085
After registering, you will receive a confirmation email containing information about joining the webinar.
We look forward to seeing you on the day!
Sentia™ patent information – https://sentiaanalysis.com/wp-content/uploads/2023/05/Sentia-Patent-Filings.pdf
Unfortunately, good wine doesn’t happen by chance. It takes meticulous crafting.
To produce a quality wine, winemakers must subject their product to a multitude of tests, checks and additions. Most wines will be filtered, stabilized, adjusted, adjusted again, screened for microbes, checked for taints, and so on. And what if a taint gets noted? Well, then we cross our fingers and hope that we’ve caught it early, because dealing with taints is a whole new ball game.
We also now have legalities to consider. Will our wine pass government-set regulatory standards, and how can we check for this? … Say hello to more testing!
Modern day wine practices that have allowed us to improve upon the quality and taste of our wines fall into a number of action-based categories. Tests that promote:
Many tests can now be performed to promote the physical and chemical stability of wine. We can navigate around problems such as protein hazes and tartrate instabilities but one of the most well-known and encountered problems is oxidation. The ability of winemakers to be able to keep oxidation damage under control has been a real game changer.
When wine is exposed to too much oxygen, oxidation ensues, and this can degrade your product in several ways. Oxygen will readily react with ethanol to produce excess quantities of acetaldehyde, leading to a fruity/sherry taint. It also readily reacts with wine components such as anthocyanins and phenols, which causes browning, unwanted aromas, and flavour profile changes.
So how do we test our way out of oxidation issues? Simple. We add an antioxidant preservative such as sulphur dioxide (SO2) that will “deal” with oxygen exposures. We then monitor the heck out of it, checking its levels and making extra additions where necessary, to ensure that we always have enough in an available form.
These days we can check SO2 concentrations via a number of methods: A/O, Ripper, modified Ripper, spectrophotometry and Sentia. And if you really want to spend some bucks, you could even try gas chromatography.
There are several microbes that can impact wine. Some of them we harness for use, and others we just want to avoid as “contaminants”. Two of the biggest contaminants commonly noted in wine are Brettanomyces spp. and acetic acid bacteria. Both can produce undesirable volatile compounds if present in wine and left untreated: acetic acid (both), and 4-ethylphenol/4-ethylguaicol (Brettanomyces).
High acetic acid levels in wine can cause an undesirable vinegar taint, while high 4-ethylphenol/4-ethylguiacol (4-EP/4-EG) levels can cause smells and flavours often described as ‘Band-Aid’, ‘medicinal’, ‘horsey’ and ‘barnyard’.
Common tests that we can now use to screen for microbial contaminants are culture plates, polymerase chain reaction procedures (PCR) and taint checks (e.g., GC-MS used for 4-EP, 4-EG testing, and Sentia or spectrophotometry easy options for acetic acid).
While there are some flavours in wine that we definitely do not want to enhance (e.g., taints), there are others that we do. A winemaker will have to make decisions based on a style of wine that they are hoping to create.
Is your wine tasting a bit flabby and flat? This could be due to your acidity levels. Best to get a titratable acidity reading here. White wine missing that sharp fruity edge? Give your malic acid levels a check.
One last reason to test your wine: legalities. In this day and age, a number of wine components must now be measured and concentrations declared.
In most countries you must declare an alcohol content on your wine and this needs to be visible on the label. There are then some components and additives that need to be checked for concentration due to “safety” requirements (e.g., SO2 and volatile acidity).
In Australia a legal limit for volatile acidity in wine has been set at 1.5 g/L (expressed as acetic acid) (AWRI). In the US, this figure varies slightly, being 1.4 g/L for red wines and 1.2 g/L for whites (expressed as acetic acid) (CFR).
At the end of the day, how much or how little a winemaker wants to test their wine is really up to them. If you’re looking to make something just “okay” and for personal use, then you can probably get away with cutting some corners. If on the other hand you’re looking to create something special, something with the potential to be genuinely remarkable, then you should s invest in some testing!
The more testing and monitoring one does during the winemaking process, the more control one has over final product outputs.
Declaration of conformity – https://sentiaanalysis.com/wp-content/uploads/2023/05/My-Sentia-RADC001-signedv1.3_NB.pdf
Please wait